One of the most predictable profile shapes you will come across is the imbalanced triple distribution profile which is normally seen around swing tops or bottoms, however, this is not always the case.
Some rules on this profile shape are required to quality the shape…
- The profile must clearly have 3 distributions
- The value area must be in the middle of the profile, not unbalanced to one side (up/down)
- The profile should print after a multi day down trend or up trend
This is NOT imbalanced triple distribution profile

You can see the value area is balanced to the UPPER region of the profile
Now lets look at a proper imbalanced triple distribution profile

We can see the value is within the middle of the profile and we have a distribution above and below the value area.
Now lets take a look at another issue that may pop up…

This is NOT an imbalanced triple distribution profile!
We can see value is within the middle of the profile, however, there is no distribution below value, only above it.
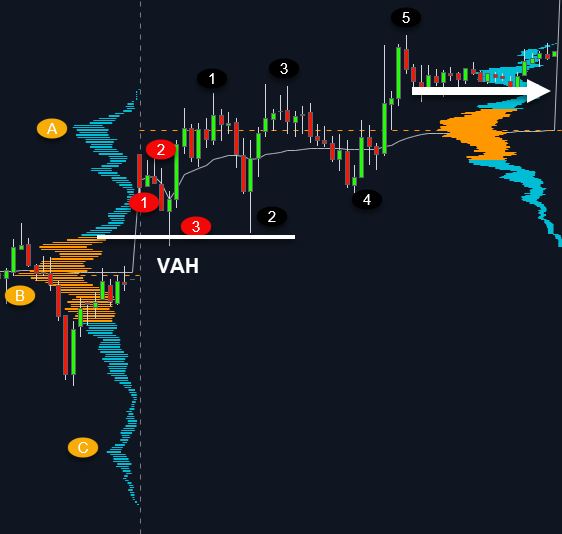
Typical behavior of this profile shape…
Right click and open image in new tab for full size

Price the following day can open in range or outside range
If opening out of range, can look for shorts back to value
Normally rotates down in 3 waves (not Elliott Wave)
Look for the longs at the VAH (value area high)
Normally rotates up in 5 waves (Not Elliott Wave)
Normally consolidates rest of session after 5 wave rotation
Average daily range is between 140-175
If opening out of range, daily range tends to be nearer the 140pts
If opening within range, daily range tends to be nearer the 170pts
Lets look at a day where price opened out of range…

Now lets look at a day where price opened within range…